
10
Oct2013
What is Microcharts? How can it clarify data?
by anon
in News, Technical
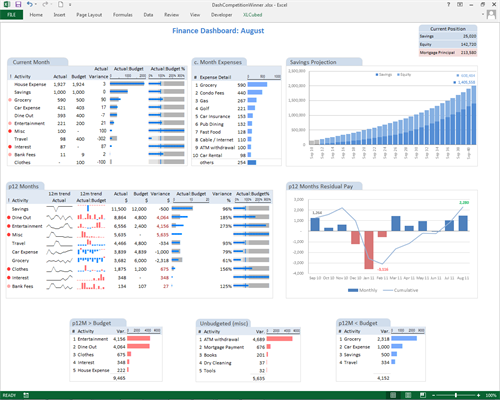
Most reports comprise one or more data tables, and as such charting has typically been via large charts above or below the numbers, or on separate sheets. Visualisation luminaries such as Edward Tufte and Stephen Few are advocates of larger numbers of smaller, more tightly focused charts to convey information.
MicroCharts, implemented though fonts, and controlled via formulae lend themselves perfectly to this approach, and can readily be used to extend existing report packs.
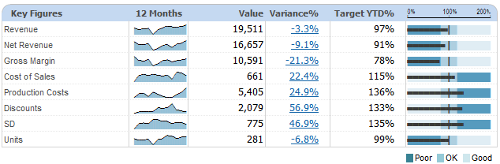
In this case an original data-only Excel table has been enhanced to graphically depict trend and target on a row basis. Significantly more data is being conveyed, and it can be assimilated much more quickly. The revenue plummet in early 05, and strongly over target YTD profit are apparent.
Each Microchart resides within an Excel cell, and as they are implemented through fonts, the user has a great degree of control over their sizing, alignment and positioning. MicroCharts can be picked up quickly by existing excel users, and used to extend existing reports or as part of custom built dashboards. The in-cell charts provided include Sparklines, Bullet Graphs, MicroColumns, MicroBars, and KPI icons. Each chart type contains rich formatting options, accessible through the intuitive user interface, and an improved colour palette.
Used in addition to Excel's native charting engine, MicroCharts can turn Excel into a truly world class dashboard development environment.
To avoid the pitfalls of Excel Spreadmarts, MicroCharts can be used in conjunction with XLCubed Excel Edition to connect the charts directly to the underlying server based data. Reports created in this way can be made dynamically available to a wider, browser based audience with XLCubed Web Edition.
Used in addition to Excel's native charting engine, MicroCharts can turn Excel into a truly world class dashboard development environment.
MicroCharts is available to download for a 30 day trial period from here.
To avoid the pitfalls of Excel Spreadmarts, MicroCharts can be used in conjunction with XLCubed Excel Edition to connect the charts directly to the underlying server based data. Reports created in this way can be made dynamically available to a wider, browser based audience with XLCubed Web Edition.
Categories
Recent Posts
Archives
- 2019
- 2015
- 2014
- 2013
- December
- November
- October
- Downsizing Dangers - 28th October 2013
- Dynamics NAV NAS/Job Queue - Excel SaveAs method failed - 18th October 2013
- New in XLCubed 7.5 - 16th October 2013
- How to suspend and resume SQL database mirroring - 15th October 2013
- XLCubed: Excel Dashboards - 11th October 2013
- Analytical Applications of Business Intelligence Reporting - 10th October 2013
- What is Microcharts? How can it clarify data? - 10th October 2013
- Can’t print from XLCubed Web Edition - 2nd October 2013
- September
- June
- February
- January
- 2012
- 2011
- November
- August
- July
- May
- A call to SSPI failed in NAV 2009 R2 - 31st May 2011
- Can’t send BizTalk documents from NAV2009 Role Tailored Client - 23rd May 2011
- Unique External Document No. on Sales Order - 23rd May 2011
- CRM 2011 – NAV 2009 R2 Synchronisation – tips and tricks - 10th May 2011
- Manually Create NAV Service Instances - 3rd May 2011
- April
- March
- February
- January
- 2010
- December
- November
- SQL Maintenance plan won't run, modify or delete - 24th November 2010
- Miscellaneous NAV RTC Development Tips - 21st November 2010
- NAV RTC Development training tools - 18th November 2010
- Microsoft Dynamics NAV Application Objects - 15th November 2010
- Delete a rogue Conur Expense Report - 12th November 2010
- CRM - 9th November 2010
- October
- September
- February
Tags
- 2009
- 64bit
- antivirus
- application objects
- BI
- BizTalk
- blocking
- Business
- Business Intelligence
- c#
- C#
- cached password
- calculation
- CGRS
- Cloud
- Commerce Gateway
- concur
- CRM 2011
- CRM 2013
- Crystal Reports
- csv
- Data Type
- date and time
- deadlock
- delete
- DotNet
- Downsizing
- Dynamics
- Dynamics NAV
- EDI
- ERP
- Excel Buffer
- External Document No.
- Generate xsd from SQL table
- impersonation
- Jigsaw
- Job Queue
- MDX
- Microsoft Excel
- NAS
- NAV
- NAV 2009
- NAV 2009 R2
- NAV Application Server
- NAV Development
- NAV Upgrade
- NAV2009
- NAV2013R2
- NAV2015
- Navision
- new version
- no delimiter
- NST
- OLAP
- Permissions
- printing
- regsvr32
- right-click
- security
- Security
- service broker
- SMTP
- SQL
- SSPI
- SSRS
- sync
- synchronisation
- umbraco
- upgrade
- User Setup
- Web Service
- xlcubed
- xmlport
- xp_ndo
- xp_ndo_enumusergroups
- xp_ndo_enumuserids